
Unemployment Insurance Initial Claims Weekly Dashboard
Initial claim totals, by supersector (state) and 3-digit NAICS industry sector (by county)
by Trends Staff
In the United States during 2020, numbers for both job creation and job losses have been in the millions and tens-of-millions. While both are part of the economic impact of COVID-19, the national unemployment rate reached 14.7% during April, 2020.
According to the U.S. Bureau of Labor Statistics, 14.7% is the highest rate since January, 1948, using these methods.
Since April, job growth has also been unprecedented, such as the 4.8 million added nationally during July, 2020 and the 1.4 million during August, 2020.
National figures are important, but most workers are limited to employment within proximity to where they live.
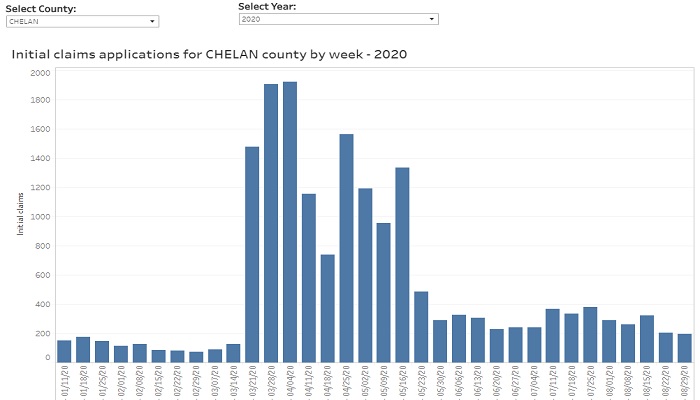
The Washington State Employment Security Department, Labor Market and Economic Analysis has created a new data interactive with helpful information for each county and for the state overall.
There are four main tabs: weekly initial claims (state), initial claims by industry supersector (state), initial claims by county, and county initial claims by industry sector (3-digit NAICS).
The interactive begins on the first tab showing a weekly view of the overall total initial unemployment insurance claims in Washington State. The second tab drills into these data showing initial unemployment insurance claims within 21 industry sectors, such as healthcare & social assistance, manufacturing, retail trade, construction, and mining.
The third and fourth tabs offer similar views, but for counties in Washington State.
The overall total initial unemployment insurance claims by county mirrors the tab for the state showing overall total initial claims. The fourth tab shows initial claims for unemployment insurance, on a weekly basis, in over 90 industry subsector categories, for every county in the state, for both 2019 and 2020 YTD.
Keep checking back as this interactive updates each week.