
200 Years of Immigration to the U.S.
Visualization demonstrates the changing status of U.S. immigration
by Trends Staff
The composition and rate of immigrants moving to the United States has seen major changes and fluctuations over the course of American history. These changes create an understanding of American immigration patterns, which is influenced greatly by domestic immigration policy and global immigration trends.
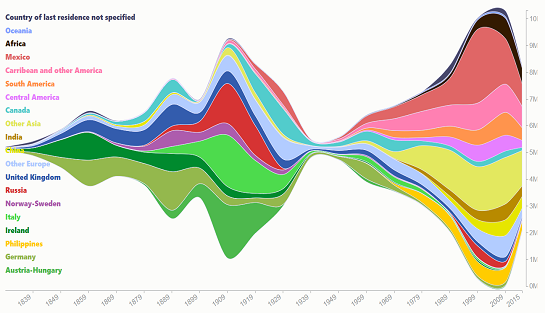
The 200 Years of Immigration to the U.S. graph, created by Talia Bronshtein using the 2015 Yearbook of Immigration Statistics, demonstrates U.S. immigration trends since 1820. This striking chart displays both the countries and regions of last residence and the number of immigrants who obtained lawful permanent resident status in the United States. The totals, percentages, and origins of immigrants is documented by intervals of 10 years.
This graph offers an eye-opening visualization of immigration trends that coincide with domestic immigration policy. For example, following the Immigration Act of 1924 which excluded immigrants from Asia entirely and set national origins quotas, there was a significant decrease in immigration across all national origin groups. This sudden decrease was preceded by a large boom in the early 1900s. Following the loosening of these immigration restrictions, we see another boom in immigration in the early 21st century, particularly from Central America and Asia.
The most current data shows that the region contributing the most immigrants to the United States is Other Asia, with 1,318,355 immigrants obtaining permanent resident status between 2009 and 2015. This number accounts for 21.28% of the total Other Asia immigrants that have obtained permanent status in the United States since 1820. The largest 10-year influx of immigrants from one country was between 1999 and 2009, wherein 1,704,166 immigrants from Mexico gained permanent residence status. This influx from Mexico has since decreased, as only 852,768 immigrants gained resident status between 2009 and 2015, a 50% decrease from the 1999 to 2009 period.
Immigrations trends are a critical indicator to follow on a national level as it greatly informs population statistics and composition. Moreover, understanding how immigration laws affect immigration trends demonstrates how policy manifests into population changes and fluxes in immigration.