County Business Patterns by Industry: 2022
by Trends Staff
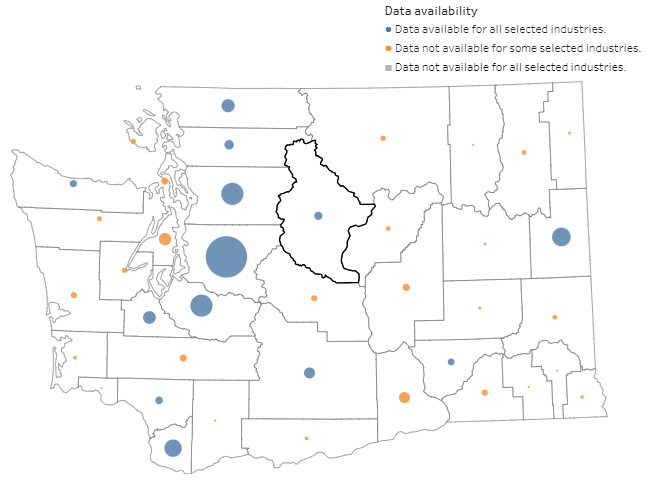
Do you know what industries are most popular nearby? The businesses around you often make up the backbone of a local economy and can connect smaller communities to the rest of the nation. The U.S. Census Bureau collects data on industries in regions all across the country, and provides access to this wealth of knowledge through tables and resources such as the County Business Patterns by Industry: 2022 graphing tool. The map provides data on the number of establishments, number of employees, first-quarter payroll, and annual payroll for each of the major industries
To the right of the map, the user can select settings like what statistic they would like to view on the map (number of establishments, employees, etc.), the level of detail that the industries are separated out into, and even what industries are shown. The map then uses proportionately-sized circles to represent the data for each state. Hovering the mouse over a state provides more in-depth information.
The user can also select an individual state from the drop-down menu, which will then provide a similar map of the all the counties in the state and their industries. From the county level map, the user can hover over an individual county to see finer details about its industries. For example, when focusing on the major sectors in Chelan County, the map shows that construction, retail trade, and accommodation/ food services make up the bulk of establishments in the county. Douglas County had similar leading industries by number of establishments, but with “other services” replacing food services.
Looking at and understanding each of the different statistics the map provides for an area can be a great way to learn about the economic landscape of a county or state there. See more information about the local economy and businesses at Chelan-Douglas Trends.

