
Business Formation Statistics by State
by Trends Staff
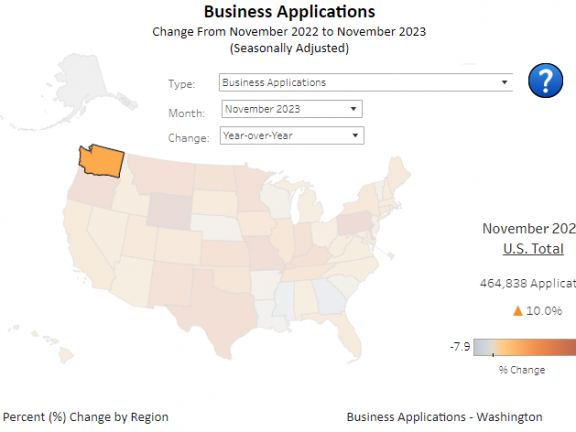
The formation of new businesses is an indicator of economic growth and prosperity within in a region. New firms have the potential to bring additional tax revenue as well as employment opportunities to the local economy. An Interactive Gallery published by the U.S. Census Bureau, titled Business Formation Statistics by State, shows the percent change in business applications throughout the United States. Rates are also available by state and region, in addition to the U.S. total. Change in applications can be seen by month-to-month or by year-over-year.
This project offers information that goes as far back as January 2005, with the most recent data from November 2023. The visualization shows increasing rates in shades of orange, while decreasing rates are shown in blue. Darker variations imply greater changes. Rates are seasonally adjusted in order to reduce the influence of predictable seasonal patterns.
Recent data reveals that trends have been favorable overall following the pandemic, although changes can appear quite volatile. The line graph in the right-hand corner shows a more complete picture of changes over time. Looking at the most recently published data for the state of Washington, we see a steading incline in applications, a large dip in April 2020, followed by a quick recovery later that year in July.
Visitors to the site can also filter by type of application, including applications from corporations and applications with planned wages. Washington State has seen a decline in business applications from corporations for some time now.
Unfortunately, this data visualization from Census lacks localized data. The net firms created and annual growth rate indicator on Chelan-Douglas trends is available for more information.