
Debt in America: An Interactive Map
by Trends Staff
The Urban Institute recently updated the data tool, Debt in America: An Interactive Map, which uses credit bureau data as well as summary tables from the US Census Bureau’s American Community Survey (ACS). The interactive map shows how different types of debt affect different communities. It specifically looks at debt in collections which include past-due credit lines as well as unpaid bills.
Visitors to the site can focus on different debt categories including, medical, student, auto/retail, in addition to the “all debt” option. Variables under the main category include: median amount of debt in collections, the share of debt in collections, auto/retail loan delinquency rate, share of student loan holders with loan debt in in default, credit card delinquency rate, and the median credit card delinquent amount.
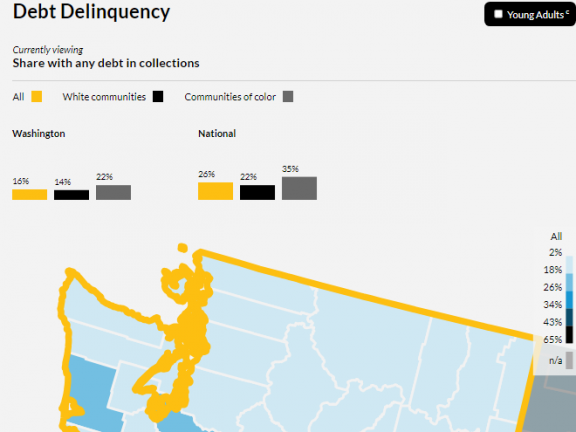
This category also features a young adult filter. People 18 to 24 are particularly vulnerable to certain debt types. It is good to note that young adults in Washington, generally, have lower rates of debt in collections than in the rest of the county. Zooming out, however, shows alarming rates throughout the Southeast portion of the country, where rates tend to be well over 20%.
All categories show how rates differ between white and communities and communities of color. The Urban Institute defined people of color as those who are African American, Hispanic, Asian or Pacific Islander, American Indian or Alaska Native, another race other than white, or multiracial. For these populations, the data show an alarming trend across all types of debt in collections; communities of color have much higher rates of debt in collections as well as median debt amounts, while having lower average household incomes. Disparities are not nearly as pronounced in the state of Washington, where debts and incomes show little contrast between communities. Small population size restricted the availability of county-level data in Chelan and Dougles Counties.