
Mapping Home Price Changes
Tracking Net Migration By County
by Trends Staff
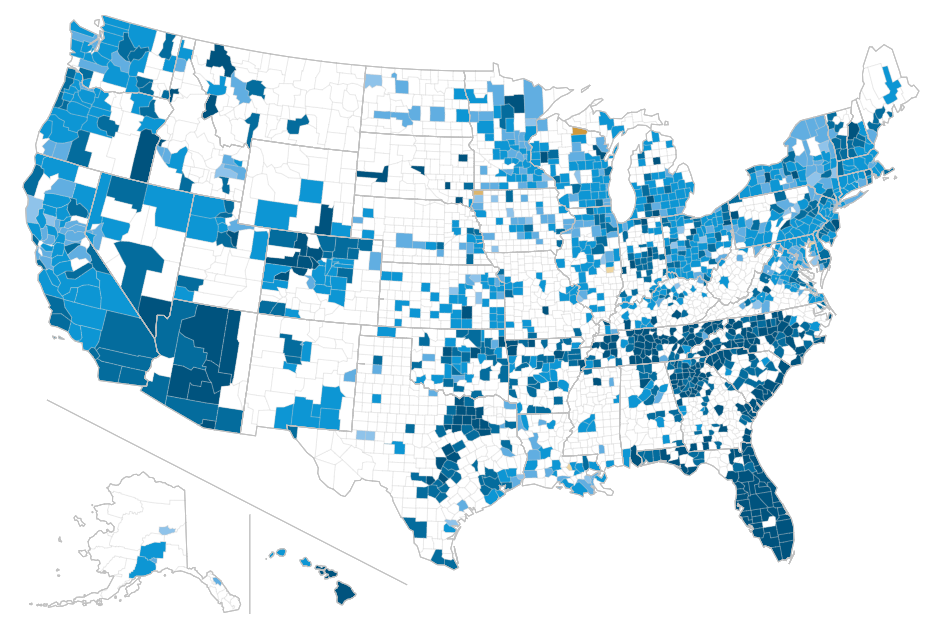
The Federal Reserve Bank of New York recently published a data visualization on home price changes from 2003 to 2022 for the entire United States. The visualization map animates month-by-month percent changes in home prices by county to illustrate changes in the United States housing market. Positive percent changes (shown in blue) indicate an increase in home price, while negative percent changes (shown in orange) indicate a decrease in home price. Zooming in shows state and county details, and hovering over a county shows the specific percent change for the selected month.
This visualization is particularly equipped to demonstrate the severe impact of the housing crisis of 2008 on home prices in the United States. Beginning in late 2006, regions of the United States, particularly the Midwest and California, begin to experience small percent decreases in home price. These percent changes worsened over time as the United States went through the housing market crash and the following severe recession. The overall United States percent change from prior prices peaks in January of 2009: -17.9%. This national average did not return to positive digits until February of 2012, where a 0.5% increase in home prices occurred.
In Washington state, the majority of the available counties indicated negative home price changes by December of 2008. The state followed national trends throughout the Great Recession, with negative changes in home prices continuing until mid-2012 for the majority of Washington counties.
Currently, the United States is experiencing substantial increases in home prices due to the economic impacts of the COVID-19 pandemic and government stimulus. In late 2020, home prices started to increase month-by-month. The national percent change in home prices reached 20.2% in April in 2022, and the most recent data report shows a 13.5% change in August over July, 2022.
This recent national trend applies to Washington State, with a vast majority of counties showing positive increases throughout the pandemic. In July of 2022, King County had a 12.3% change, Spokane County had a 13.2% change, and the most notable change was recorded in Stevens County at a 19.8% change in home prices over the course of the month.