by Dr. Patrick Jones
As the companion story on overall population growth of this issue explains, it’s newcomers who drive population growth in Chelan and Douglas Counties. Or more precisely, the balance of those moving in over those residents moving out. Over the 2020-2021 period, demographers at Washington’s Office of Financial Management (OFM) put that balance at 1,323.
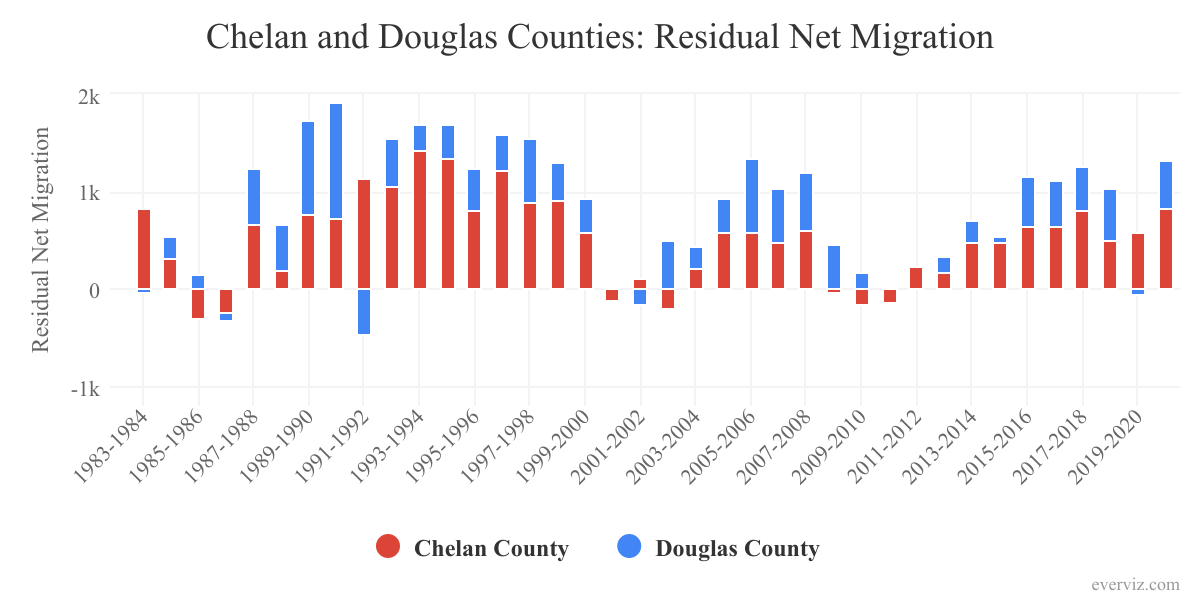
Chelan Douglas Trends indicator 0.2.1 tracks this important demographic in the two counties. As can easily be seen, the net inflows of new residents over the pandemic period 2020-2021 was much stronger than the 2019-2020 period. It represents the highest mark into the two counties since the boom years of 2005 and 2006. Note, however, that the neither that boom or the current uptick comes close to matching the net inflows for most of the 1990s into the two counties.
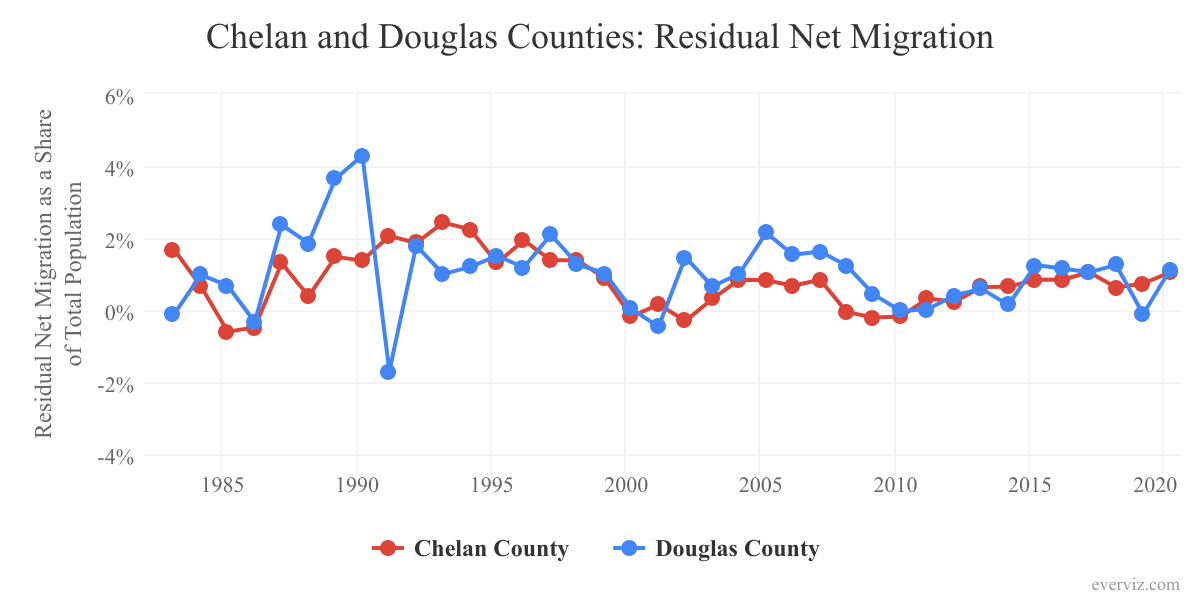
When expressed as a percentage of the total population, net in-migration to the two counties was higher in 2020-2021 than in Washington State, at slightly over 1.1% of the total population. The relative strength of the area’s newcomers also was higher than any metro area in Eastern Washington, with the exception of Grant County, where the contribution of new residents was 1.2%. More broadly, the relatively presence of newcomers in Chelan and Douglas Counties was slightly larger than in the fastest growing metro in the state, the Tri Cities, and more than twice as large as the contribution of in-migrants to Spokane.
What attracts people to move to a new home? Traditionally, the largest pull has been the prospect of a job. Numbers for all of 2021 are not yet in, of course. For 2020, not surprisingly, the number of residents of the two counties employed in 2020 was considerably lower than in 2019 – by nearly 5,500.
The number has climbed since the end of last year, thankfully. The most recent monthly report, from November, shows a gain of nearly 3,000 employed in the two counties over November of last year. That level brings current employment numbers to about the pre-pandemic peak. How many of the newly employed are newcomers or residents? Undoubtedly, it’s a mix. Yet, since the average 2020 employment loss was so deep, it is likely that a good portion of the newly employed are residents as of 2019.
Beyond the lure of local jobs, remote work might be the attraction of the area to newcomers. The pandemic has pushed many to work from home, and in many cases, home can be anywhere. Yet, data don’t tell us how large the remote workforce in the greater Wenatchee area has been and how much it has gained during the pandemic.
The most recent data on the relationship between residents’ home and their place of work stems from 2019 via a U.S. Census tool, On the Map. It shows that for Douglas County, about 80% of working residents were employed outside of the county. Undoubtedly, the majority of those worked in Chelan or Grant Counties. For Chelan County, the majority (60%) of people living in the county were employed in the county. Still, these Census numbers point to nearly 15,000 Chelan County residents working outside of the county, with only a fraction of those working in Douglas County.
So it appears that the local workforce, and in Chelan County particularly, has a strong footprint in workplaces outside the county. We will need to wait until the 2020 data release to know whether this footprint enlarged over the pandemic.
Retirement provides another to move. While the area hasn’t appeared on too many” best places to retire” lists, it has a growing senior population. In 2020, over one fifth (21.4%) of the local population were ages 65+, as Trends indicator 0.1.3 clearly shows. That share has increased from 15% from 2010. It is far higher than the share of this group in the state – 16.7% in 2020. And it’s the highest share among all Eastern Washington metros.
Most of the growth in this age group is undoubtedly due to resident baby boomers hitting that threshold. Yet, some is certainly due to people who have chosen the two counties as their retirement haven.
How might net migration flows for 2021 look when OFM publishes their estimates next July? Unless the number of people of leaving the area has greatly increased over 2020, net migration should be stronger. Monthly data from Washington State’s Department of Licensing (DOL) gives some insights, since everyone permanently moving from another state must “surrender” their current licenses to receive one from Washington state.
For the year up through August, drivers license surrenders in the two counties numbered 737. This is about 200 more than for the same period last year. It’s likely, then, that 2021 will show an increase. But the gain likely won’t too much higher than shown through August because surrenders rebounded in the fourth quarter of last year. And let’s not forget that DOL data does not track those residents who left the two counties.
Of course, the two counties attract new residents from the rest of Washington, not just from out of state. A preliminary analysis of another Census product, County-to-County Migration Flows, shows that, in sum, in-state net flows are about equal the net flows from those out-of-state. So there will likely be a modest net gain of new residents here from the other 37 counties in the state.
It may be of interest to know what geographies contribute the most to the gains (or losses) in population. DOL puts California at the top by a significant margin, over the 2nd place state, Oregon. For the recent (2019-to-present) period, rounding out the top five contributing states were: Arizona and Idaho, with Colorado and Texas vying for the fifth spot. Keep in mind that these are based only on inflows, not net flows.
The Census product gives both gross and net flows. The most recent table is from a slightly earlier period (2015-2019), but largely shows a similar pattern to the DOL data. California is the largest net provider of new residents. Napa and two Central Valley counties, Fresno and Stanislaus, made up the top three contributing counties.
The Census also reports the top contributing counties in the state, on a net basis, to the greater Wenatchee area as: Benton, Snohomish and Yakima. The area’s highest net “losses” were, in order to: Grant, Franklin and Clark Counties.
In sum, net in-migration captures many currents, some of which are offsetting. Data sources don’t give us exact information on entrances and exits from the two counties for about half of the flow, that from in-state. But in recent years, the overall result has been modestly positive, with the most recent one, quite strong.