
Racial and Ethnic Diversity in the U.S.: 2010 Census and 2020 Census
Tracking the diversity index
by Trends Staff
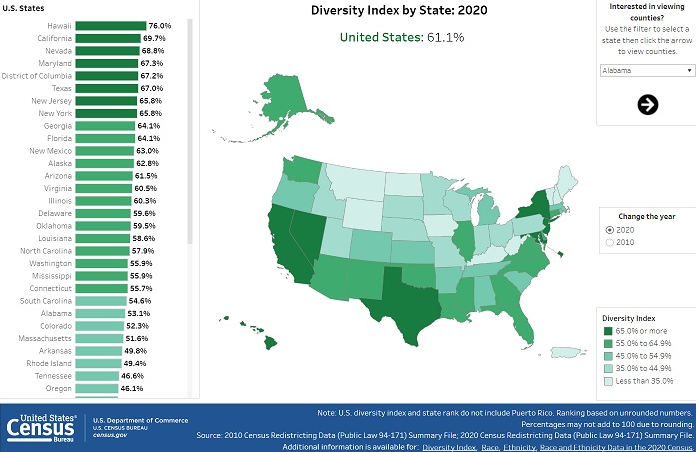
What is the diversity index? It’s a set of numbers that measures the probability that two people chosen at random will be from different race or ethnicity groups. Values for the diversity index range from zero to one. The visualization seen here, published by United States Census Bureau, shows the diversity index converted into percentages.
An index value of one, for example, would mean that two randomly chosen people would have a hundred percent chance of belonging to different racial or ethnic background. A zero value is indicative of a completely homogenous population.
The Census Interactive Gallery uses the diversity index to create a visualization of the change in diversity across the United States in the years between 2010 and 2020. Users can view state averages by scrolling through all fifty states on the left-hand side. A breakdown by race and ethnicity of the population can be seen by hovering above the state of interest on the interactive map. A trend in diversity across the country, over time, can be seen by switching between the 2020 and 2010 Census.
Index numbers have generally risen. This is the case in Washington State which shows a 55.9 percent diversity index reading for the 2020 Census, a 10.5 percentage point increase from 2010. Users interested in particular counties can follow instructions located on the top right corner of the map. The largest minority group by population is Hispanic or Latino in state and most counties, including Chelan and Douglas.
Interestingly, higher diversity percentages are not limited to counties in the surrounding areas to Seattle. Chelan and Douglas Counties both have diversity percentages in the 45.0% to 54.9% range. They too have seen increasing levels of diversity between the two Census years. Douglas County saw the biggest change, 7.4 percentage point gain over 2010 while Chelan County saw a 5.2 percentage point gain.