
Feeding America and 2nd Harvest Food Banks
Food Insecurity and the Impact of COVID-19
by Trends Staff
2020 has presented us with more than a few unique challenges. The most strenuous are likely those existing before the COVID-19, ultimately made worse by the pandemic. The most concerning are any increased challenges to the most basic necessities of life: food, clothing, and shelter.
Every year, Feeding America calculates the estimated shares of both the overall and youth populations who had faced with food insecurity “to improve our understanding of food insecurity and food costs at the local level.”
Feeding America defines hunger as “a personal, physical sensation of discomfort” and food insecurity as “a lack of available financial resources for food”.
Feeding America uses the U.S. Department of Agriculture two-part definition of food insecurity:
- Low food security “reduced quality, variety, or desirability of diet. Little or no indication of reduced food intake.”
- Very low food security “multiple indications of disrupted eating patterns and reduced food intake.”
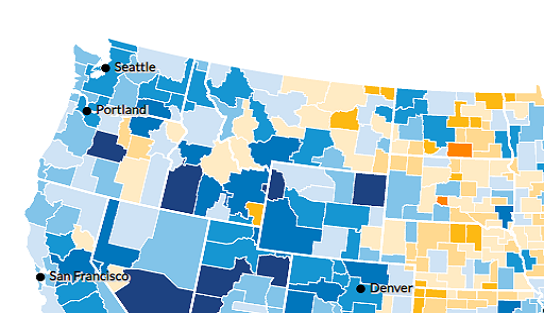
While it is too early to know what the current shares of Walla Walla County food insecurity, Feeding America recently released the 2014-2018 food insecurity estimates along with new 2020 estimates taking into consideration the impact of COVID-19 on food insecurity.
This information is available in a data visualization called Map the Meal Gap. Specifically, this visualization shows a map of the U.S. and the shares of the total and youth populations having struggled with food insecurity in the last 12-months.
Without giving everything away, during the 2014-2018 time period (using a 5-year moving average) the share of the total population who faced food insecurity in:
- Washington State was 10.7%. The share of the youth population was 14.7%.
- The U.S. was 11.5%. The share of the youth population was 15.2%.
It’s too important of a subject not to have a look at Walla Walla County, neighboring counties, and other states as benchmarks to Washington State, so we are not providing them here – you have to look at the data visualization. While each location in the U.S. likely has unique challenges regarding food insecurity, the methodology allows for a direct comparison of estimates for any location offered in the map.
According to their website, “Second Harvest distributes over 2 million pounds of free food each month to help people in need in 26 counties in Eastern Washington and North Idaho.” Click to learn more or about how you can help.
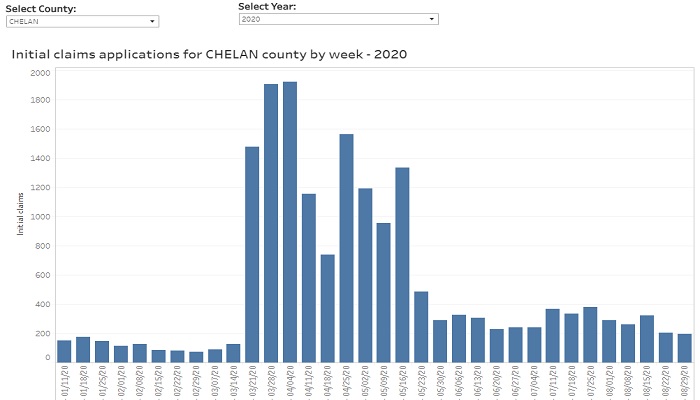
Unemployment Insurance Initial Claims Weekly Dashboard
Initial claim totals, by supersector (state) and 3-digit NAICS industry sector (by county)
by Trends Staff
In the United States during 2020, numbers for both job creation and job losses have been in the millions and tens-of-millions. While both are part of the economic impact of COVID-19, the national unemployment rate reached 14.7% during April, 2020.
According to the U.S. Bureau of Labor Statistics, 14.7% is the highest rate since January, 1948, using these methods.
Since April, job growth has also been unprecedented, such as the 4.8 million added nationally during July, 2020 and the 1.4 million during August, 2020.
National figures are important, but most workers are limited to employment within proximity to where they live.
The Washington State Employment Security Department, Labor Market and Economic Analysis has created a new data interactive with helpful information for each county and for the state overall.
There are four main tabs: weekly initial claims (state), initial claims by industry supersector (state), initial claims by county, and county initial claims by industry sector (3-digit NAICS).
The interactive begins on the first tab showing a weekly view of the overall total initial unemployment insurance claims in Washington State. The second tab drills into these data showing initial unemployment insurance claims within 21 industry sectors, such as healthcare & social assistance, manufacturing, retail trade, construction, and mining.
The third and fourth tabs offer similar views, but for counties in Washington State.
The overall total initial unemployment insurance claims by county mirrors the tab for the state showing overall total initial claims. The fourth tab shows initial claims for unemployment insurance, on a weekly basis, in over 90 industry subsector categories, for every county in the state, for both 2019 and 2020 YTD.
Keep checking back as this interactive updates each week.
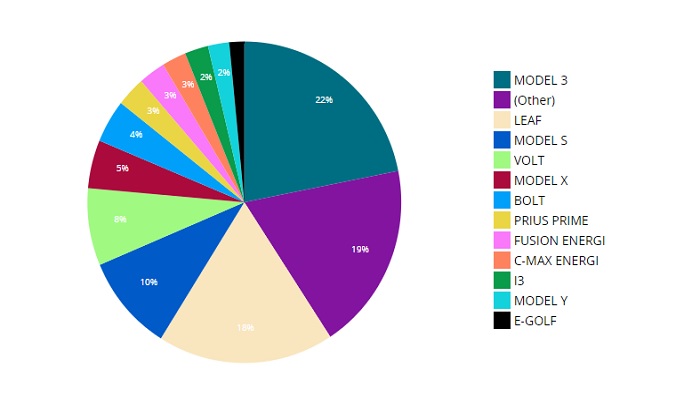
Electric Vehicles in Washington State: Access Washington – data.wa.gov
Currently registered vehicles by vehicle type and by county
by Trends Staff
When something is the first, there is no need to put a number after it – until there is more than one. Examples include the modern Olympic Games, movies with a sequel, and the Sony PlayStation.
The same can be said for an Industrial Revolution. While the term has somewhat come to represent the sum of human technology and advancement, there have been three separate Industrial Revolutions throughout history. Some argue we are currently in “Industry 4.0”, or the Fourth Industrial Revolution where cyber / internet is advancing allowing our physical, digital, and biological worlds to swirl and blend together.
While we do know cyber / internet has changed society, we will leave this for future historians to consider.
If we are living in Industry 4.0, this era will continue to produce inventions changing our lives and future generations. Inventions driving humanity forward, for better or worse, such as the internal combustion engine, electric engine, jet engine, and the internet search engine.
A few years ago, owners of electric cars could drive very limited distances from home – or at least within proximity to electrical outlets. As the number of electric vehicles increases, demand for a new infrastructure, charging stations, also increases. For hybrid vehicles (those using both gas and electricity) this is much less of a concern.
Today, Washington State has developed a significant electric vehicle charging infrastructure, including being part of the West Coast Electric Highway. This has literally opened the road for electric vehicles, generating new public and private investment to continue building the electric vehicle charging infrastructure across Washington State.
Eventually “gas-burners” will go the way of the dinosaur, but not overnight. Knowing the number of electric vehicles on the road is helpful, but a specific location helps investors know where increasing the charging infrastructure is needed most.
Further, knowing the exact type of electric vehicle popular in a specific location might shed light on a community’s commitment to electric vehicles by purchasing more of them overall, or a larger percentage of high-end models than elsewhere in the state.
Data.wa.gov has created a new data visualization showing all currently registered Battery Electric Vehicles (BEVs) and Plug-in Hybrid Electric Vehicles (PHEVs) in the state. Filters include vehicle type (BEV and PHEV) and model, but also by county, city, and legislative district.
This information likely will not be part of a future Fourth Industrial Revolution conversation, but it can help both public and private entities make informed decisions now.
Taxable Sales per Capita in the Retail Trade Sector: Outperforming the Region but Shifting Locally:
by Brian Kennedy and Dr. Patrick Jones
Since the Great Recession, many adjustments in consumer spending habits have occurred. Tracking the trends of how retail spending has changed over time can shed light on how the local economy is doing. One way is through retail sales per capita. This measure serves as a proxy for the pace of economic activity, given that consumption spending forms the largest portion of most US regional economies. The measure captures consumer spending on big-ticket items such as cars and furniture as well as everyday purchases such as gas, clothing, books. Significantly, in Washington State it also includes online shopping.
Measuring retail sales on a per capita (simply taking all retail sales and dividing it by the resident population) helps determine the communities’ overall retail leakage, or how many dollars are spent outside the county by its residents. If leakage is high, in this situation, the graph would depict lower per capita measures. However, this can also move in a positive direction, where local retailers (as well as internet sales) attract high resident spending. Or where visitors spend money earned elsewhere. In both of these cases, one would expect much higher values in the per capita measure as more spending is occurring county’s population. This scenario is more aligned with the data that in Indicator 2.2.8.
The trends found on the graph show the retail sales per capita for the combined counties of Chelan and Douglas, along with a few other counties which serve as comparisons. In 2019, the combined counties posted retail sales per capita of $11,243, which was roughly $1.3 billion in total retail sales. The per capita measure has steadily grown by a compound annual growth rate of about 3% since 2004. Growth has occurred every year except the two years tracking the Great Recession of 2008-2009.
As observed in the trend lines, spending in the combined counties sits well above the other comparable Eastern Washington metro area benchmarks, with the exception of Benton County. This likely indicates the ability of local retailers to retain local dollars. This also likely indicates that Chelan and Douglas Counties are able to bring in additional money through visitor spending, in a sense, poaching consumers’ dollars from outside the community. That is easy to observe to anybody who lives or has visited the region. Ranging from hiking in the Enchantments, having a lazy beach day on Lake Chelan, taking in the local wine scene, strolling through the themed streets of Leavenworth, shopping Pybus Market, Waterville Days in the historic Douglas County Seat and the Douglas County Museum - there are many places and events to entice visitors to come spend in the community.
While Chelan and Douglas Counties are posting better rates than the other communities on the graph, spending here is right on par with Benton County’s. This county, home to two thirds of the population of the Tri-Cities, acts as a retail hub for much of the surrounding portion of Southeast Washington and northern Oregon. There aren’t a lot of options for shopping centers, auto dealers, or big box stores in places Columbia, Umatilla, Adams, and even Walla Walla Counties. Thus, the Tri-Cities have been able to capitalize on relative retail scarcity in adjacent counties.
As we can see, the combined counties are doing quite well, but what does a spending breakdown look like within the two counties? Up until about 2014 Chelan County had been leading the two counties, since then Douglas has taken over that role. This is largely resulting in the type of businesses residing in the two counties, and using Department of Revenue taxable retail sales data by sector we can see these differences.
Chelan County’s high retail spending per capita is largely driven by tourism and the resulting construction. Since 2004, total retail spending has increased by 66%, with the fastest growing sectors within retail building materials and garden equipment (increasing by 76%), along with general merchandise stores which includes most big box stores and supercenters (increasing by 32%). The Great Recession was the biggest setback to the county’s economy in modern times. The event caused retail sales per capita to slide for five consecutive years after 2007, not recovering to pre-recession levels until 2016.
Douglas County on the other hand, has been a steady underdog. While it experienced a slight decline through the Great Recession, the County rebounded in terms of retail sales per capita much earlier, surpassing the 2007 peak as early as 2011. While Douglas County spending levels had still been lower than its counterpart across the river, beginning in 2014 that relationship had flipped.
The sectors driving retail sales in Douglas County are not reliant upon the tourism industry nearly as much. The data tell us that new and used auto dealers, general merchandise stores, and electronics and appliances have been leading the charge. In a county with roughly half the population as Chelan, Douglas’s general merchandise stores did about $10 million more in sales in 2019 and electronics and appliances did about $26.7M more in sales. Additionally, auto sales have grown by 240% since 2019.
To sum up, the combined counties have continued to outperform the surrounding Eastern Washington metros. However, the composition of growth has been shifting, not only among industries but between the two counties as well. It seems the outdoor recreation and beauty make Chelan County a strong draw for visitors, but residents of the greater Wenatchee area are increasingly spending their money in Douglas County.
Total Food and Beverage Manufacturers: Year-to-year increases in licensed manufacturers is common:
by Scott Richter and Dr. Patrick Jones
Often a strong agriculture sector goes hand-in-hand with processing crops into marketable foods. More importantly, when agriculture and food and beverage manufacturing sectors are prevalent in an area, employment is usually steady and dependable. While nothing is written in stone, these sectors help to form the economic backbone of a region. Why? Perhaps the major reason is crops and food and beverage manufacturing facilities are bound to the ground where the crops are found. In other words, businesses in these sectors do not relocate.
Processing implies keeping more of the eventual value of the crop local. Further, over the last several years, processing is capturing what both economists and farmers call “value-added agriculture”. In other words, a finished bottle of wine is typically more valuable than the grapes it took to produce the wine. Other examples include apples being stemmed, sliced and packaged for sale, drying fruit, and fruit being processed into juices.
While it is a little more difficult to apply the concept of value-added agriculture to grains, but this is likely due to additional processing steps to turn grains into a final consumer end-product – and this is not to imply it does not occur in Chelan & Douglas Counties.
When someone thinks of manufacturing, it’s probably common to think of things like machines, computers, chemicals, toys, and sporting equipment. Food & beverage manufacturing make up a significant part of the manufacturing sector, producing consumables such as cereals, bottled water, and packaged salads.
According to the U.S. Bureau of Labor Statistics (BLS), industries within the Food Manufacturing subsector “are distinguished by the raw materials (generally of animal or vegetable origin) processed into food products”. Once processed, the final products are distributed to wholesalers and retailers, who then sell to consumers. Bakeries and candymakers are also part of the Food Manufacturing subsector.
Washington State defines food processing as “…handling or processing any food in any manner of preparation to be sold for human consumption”. Further, repacking foods (when products from large containers are broken down into smaller packages or combined with other foods to create items such as trail mix, mixed salad, meat and cheese trays, etc.) are also considered food processors.
Since there are no tobacco product manufacturers in either Chelan or Douglas County, this portion of the subsector represents Beverage Manufacturers. According to the BLS, Beverage and Tobacco Product Manufacturing subsector “Beverage Manufacturing, includes three types of establishments: (1) those that manufacture nonalcoholic beverages; (2) those that manufacture alcoholic beverages through the fermentation process; and (3) those that produce distilled alcoholic beverages.”
Food and beverage manufacturing in the two counties is alive and well. Indicator 2.5.3 shows the total number of food and beverage manufacturers in Chelan, Douglas, and the combined counties. Beginning in 2014, the number of manufacturers in the combined counties has increased from 58 to 81 in 2019 while the share of persons working in this sector out of all employed in the two counties increased from 1.0% to 1.4%.
By county, the number of food and beverage manufacturers increased from 55 during 2014 to 74 in 2019, while the share of employed persons working in this sector out all employed persons in Chelan County increased from 1.3% to 1.6%. In Douglas County beginning in 2014, the number of food and beverage manufacturers increased from 3 to 7 in 2019 while the share of employed persons working in this sector out of all employed persons in Douglas County increased from 0.2% to 0.8%.
While manufacturing is not a large sector in the local economy, it lands among the top 10 in each county: the 7th largest in Chelan County and the 6th largest in Douglas County, by headcount. Within local manufacturing, food and beverage production plays an outside role. It is the largest sub-sector in Chelan County, claiming over 35% of the workforce in 2019. At 18% of the manufacturing workforce in Douglas County, it appeared to the largest there as well during 2019.
While food processing is not limited to crops grown or livestock raised locally, Chelan and Douglas Counties undoubtedly have a strong agricultural sector. Indicator 2.1.4 shows Agriculture, Forestry, Fishing, and Hunting was a top-5 employing sector in Chelan & Douglas Counties combined during 2019 paying an annual average wage of $28,812.
While many things are grown and raised in the area, local food and beverage processing manufacturers are most likely to process the local harvest and import much less of what becomes processed food ready for consumption.
During 2017, the top crops (in acres), according to the Census of Agriculture, in:
- Chelan County were Apples (7,917), Pears, all (7,815), Cherries, sweet (5,654), Forage, hay, all (2,199), and Grapes (558).
- Douglas County were Wheat for Grain, all (156,829), Apples (7,501), Forage, hay, all (7,272), Canola, sweet (7,215), and Cherries, sweet (3,127).
The demand for food increases as the population increases. The demand for value added food follows trends of urbanization, time constraints on cooking for busy households and income. This should augur well for food & beverage processing in the counties. The U.S. population continues to grow, urbanization and time-pressed households show little sign of abating, and U.S. incomes are rising. Additional demand and marketing opportunities for processed foods and beverages manufactured locally can come from globe markets
It will be interesting to see how this indicator reflects the impact of COVID-19 on the demand for foods and beverages manufactured locally. While demand is not likely to change other than the annual increases in the number of licensed manufacturers seen in this indicator, the ability of previous customers to continue buying certain products might be affected. If this occurs, let us hope the reaction is short-lived.
Employment in the Local Healthcare Sector: Growing Strongly:
by Dr. Patrick Jones
Healthcare in the greater Wenatchee area has come a long way in the past 15 years. As Indicator 2.3.3 shows, it is now the third largest sector, measured by employment. Only agriculture and government are larger.
The share taken by health care and social assistance of the total work force in the two counties has climbed from 10.5% in 2004 to 12.8% in 2019. Among the five largest employing sectors in the two counties, that growth has trailed only the hospitality industry. (Construction and manufacturing have also experienced higher growth rates but their employment levels are not nearly as large as healthcare and social assistance.) It is worth pointed out that the current importance of health care and social assistance to the two counties is not unique in the metro areas in eastern Washington. Several sported shares in 2019 that were higher than here: Yakima at 14.4%, Walla Walla at 15.5% and Spokane at 18.6%.
A relatively new Trends addition, found here and below, and located in the Our Valley Our Future / Nuestro Valle Nuestro Futuro category, focuses solely on the sector’s numbers. It tracks the growth of employment levels, showing a climb from about 4,900 to 7,250 over the past 15 years. As the graph reveals, that growth rate closely matches that of the state.
What has driven the jump in the size of healthcare and social assistance in the two counties? Undoubtedly, the single most important factor is population growth. Over the same period (2014-2019), population in the two counties has moved from approximately 102,000 to 121,000. That represents a cumulative gain of 18%. Yet, the gain is lower than the cumulative growth of the sector, at 33%.
Another factor likely playing a role is the greater prevalence of health insurance among the residents of the two counties. As Indicator 5.4.1 shows, the rate of the uninsured has dropped by 46% between 2009, the start of the series, and 2019. A greater number of patients seeking care outside of a hospital emergency department will create a greater demand for medical professionals.
Yet another factor is age. As Indicator 0.1.2 lays out, median age in the two counties has risen over the largely same interval, from 37.5 to 39.5 years. (And note that the two counties have been consistently “older” than the benchmarks of the U.S. and the state.) Over the last decade, the share of the population that is 65+ has climbed from 14% to 20%. An older population simply requires more interaction with the healthcare sector.
Certainly, the efforts of the local hospitals to boost the numbers of healthcare professionals overall, and physicians in particular, have factored into the growing share of healthcare and social assistance here. Indicator 5.4.3 shows the steady growth path of physicians in the two counties. Between 2011 and 2019, the number of MDs and DOs climbed dramatically, by 74. While the concentration of physicians in the population is still considerably below that of Washington’s, it has increased – from 2.33 to 2.74 physicians per thousand residents.
Of course, as we consider this sector, we should be mindful that it encompasses more than physicians and hospitals. The largest sub-sector was, in fact hospitals, with about 50% of the total sector workforce in 2019. Within any hospital, physicians are but one, albeit highly important, component of staff. The second largest sub-sector was ambulatory care. While this refers to physician offices, it also covers the offices of dentists, counselors, and the gamut of therapists. It made up about 22% of sector employment in 2019. The third largest subsector was consisted of social assistance workers. This includes above all service providers to the elderly (but not nursing homes) and disabled, followed by childcare centers. In the 2019, these firms made up about 17% of the sector. The fourth largest sub-sector consists of nursing and residential care facilities; these operations contributed 12% of all sector jobs last year.
Among these subsectors, where has the largest growth occurred? Due to data constraints, we can only compare the past five years. The short answer: hospitals. Staff in the hospitals in the two counties has climbed by over 800 since 2014. In contrast, the count at free-standing medical offices has actually declined. It appears that employment at residential care (nursing homes, assisted living) has not increased much at all. Social assistance employment, on the other hand, has shown modest growth over the past five years.
What might the next five years bring to the size of the healthcare sector here? In this observer’s opinion, it will most likely continue its rise, if population growth in the two counties continues its recent path. And compared to other eastern Washington metro areas, the share of the workforce here taken up by healthcare workers still has room to increase.